Better Reports, Better Decisions
August 10, 2026
By Jim Schiele

In today’s data-rich environment, school districts have no shortage of reports. Financial reports, enrollment reports, staffing reports, budget reports, compliance reports, the list can grow quickly. But more reporting does not always mean better decision-making.
A report is only valuable when it helps the reader understand what happened, why it matters, and what action should come next.
Too often, reports continue to be produced simply because they have always been produced, even when their purpose is unclear or their usefulness has diminished. Monthly financial reports to boards of trustees are a common example: they may be routine, but they do not always provide the clarity or direction decision-makers need.
Strong reporting should include the answer to three simple questions:
- What is the purpose of the report?
- What period does it cover?
- What is the data source?
If those questions are answered clearly, the report is already on a better path.
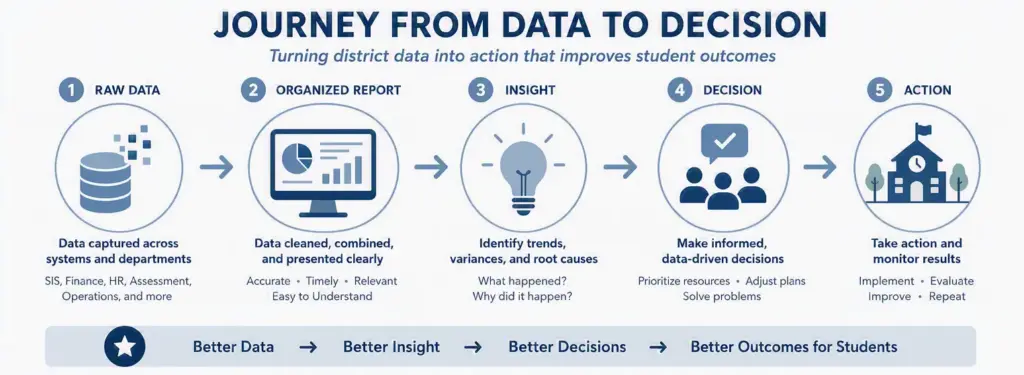
Start with the “Why”
Before designing or revising any report, define its purpose. What question should the report answer? Who will use it? What decision or action should result from reviewing it? Is the report intended to support strategic planning, operational oversight, compliance, or financial monitoring?
Without a clear purpose, reports can become overloaded with data. Readers may spend valuable time searching for the information that matters most or, worse, make decisions based on incomplete context. A focused report should include only the metrics, tables, and visuals that support its stated objective.
For example, “Monthly Financial Report” may vaguely describe the document, but not its purpose. A clearer objective might be: “To provide district leadership with a summary of monthly budget performance by fund and identify potential expenditure variances requiring review.”
That purpose gives the report direction and gives the reader a reason to engage with it.
Make the Time Frame Obvious
Readers should not have to guess whether the data reflects a single month, a fiscal year, year-to-date activity, a comparison period, or forecasted information.
A clear title or header can make a significant difference. Instead of “Enrollment Report,” use “Enrollment Report – Fiscal Year 2025-26 Through June 30, 2026.” Instead of “Monthly Budget Report,” use “Monthly Budget Report – June 2026.” This small change immediately gives the reader context and reduces the risk of misinterpretation.
Consistency also matters. When reporting periods are defined and used consistently, districts can more easily identify trends, compare results, and understand changes over time.
Identify the Source of the Data
Your audience should quickly be able to identify where the information originated, when it was extracted or refreshed, and whether multiple systems were used. Clear data sourcing helps users validate information, understand limitations, resolve discrepancies, and build confidence in the report.
This may be as simple as noting: “Financial data extracted from the General Ledger system on July 1, 2026, at 6:00 AM.” If the report combines sources, identify them clearly. For example, “Student enrollment records from the Student Information System and staffing data from the Human Resources Information System.”
Reports should also document key definitions, assumptions, and ownership for ongoing maintenance. This is especially important when data may be affected by future changes to school finance, proposed tax rates, growth factors, or other assumptions.
Keep the Reader Focused
Even accurate data can lose value if it is difficult to understand. Effective reports highlight key metrics first, use visuals only when they improve understanding, avoid unnecessary clutter, and provide enough context to explain significant variances or trends. Consistent formatting, terminology, definitions, and calculations also help readers compare information with confidence.
Before publishing a report, ask whether it clearly identifies its purpose, audience, reporting period, generation date, data sources, key metrics, definitions, and calculations. Most importantly, ask whether it supports decision-making and action.
The best reports are not necessarily the longest or most detailed. They are the ones that communicate the right information to the right audience at the right time. By defining the purpose, clarifying the time frame, and documenting the data source, districts can improve data quality, increase user confidence, and support better decisions.
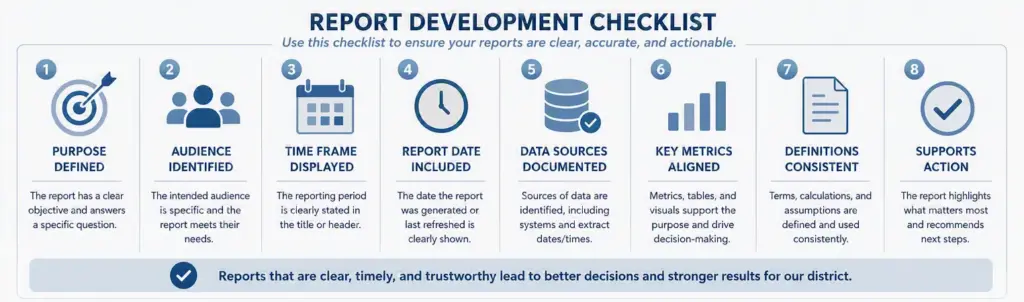
Report Development Checklist
Before publishing any report, verify:
- The purpose of the report is clearly defined.
- The intended audience has been identified.
- The reporting time frame is prominently displayed.
- The report generation date is included.
- Data sources are documented.
- Key metrics align with the report’s purpose.
- Definitions and calculations are consistent.
- The report supports decision-making and action.
As always, we are available to further discuss the preparation and presentation of reports for your district.
Jim Schiele is Linebarger’s School Financial Consultant. He offers free assistance to Linebarger school district clients as they navigate budgets and meet financial deadlines. He can be reached at jim.schiele@lgbs.com.
This content is intended and provided solely for educational and/or informational purposes. It is not intended to provide legal advice, nor does your receipt of this content create an attorney-client relationship. This content is not a substitute for the specific legal advice of an attorney licensed in your jurisdiction.
If you are a current or prospective client this content may be subject to the attorney-client privilege or the attorney work product privilege or otherwise be confidential. Any dissemination, copying or use of this content by or to anyone other than the designated and intended recipient(s) is unauthorized.