Analyzing the Monthly Financial Statement
October 12, 2026
By Jim Schiele

Last month we discussed the importance of providing trustees with timely, accurate, and actionable financial information. A monthly budget-to-actual report is often the foundation of that discussion.
However, the value lies not in producing the report, but in analyzing what the numbers reveal. While financial software generates reports efficiently, meaningful decisions require understanding the activity behind the figures.
Look at History
Historical spending patterns provide important context. Review at least three to five years of expenditures by month, function, and year to identify recurring trends and determine what percentage of annual spending typically occurs in each period. When patterns change, identify the operational reason and consider whether current-year conditions are likely to alter historical expectations.
For example, if a function, like utilities, traditionally spends 7% of its annual budget in one month and 12% in another, there should be an operational reason. Seasonal activities, scheduled purchases, payroll patterns, contracts, or other timing issues may explain the variation. Understand what’s driving your numbers.
Then ask whether those patterns have changed over time. Is there a discernible trend? Are current-year operations expected to change the historical pattern?
This analysis needs to be done for every function. Although this analysis requires effort initially, standardized templates make ongoing monthly reviews much more manageable. Download our sample excel sheet to follow along with the examples we discuss. We use function 51, facility maintenance and operations in the spreadsheet, with the first tab containing the average over several years. The second tab shows the monthly variance and the year-to-date variance as well as a projection to the end of the year.
Don’t Assume 50% of the Year Means 50% of the Budget
Expenditures rarely occur evenly throughout the year. Consequently, year-to-date spending should be compared against historical spending patterns rather than the percentage of the fiscal year completed. This distinction is critical when projecting year-end results, as seasonal costs, contract changes, and other timing factors can make spending appear ahead of or behind budget when it is on track.
This is particularly important when projecting year-end results. Resist the temptation to conclude that the budget is over- or under-performing until the historical pattern has been considered and a realistic year-end projection has been developed.
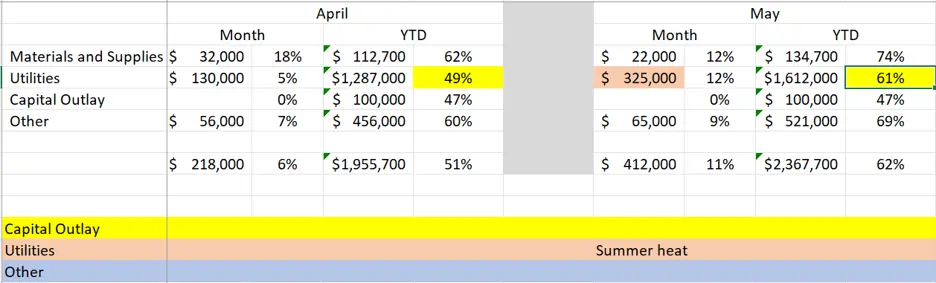
In the above example, by April, actual utility expenses consumed 49% of the annual total. However, we know that utilities are likely to climb quickly once warm weather arrives, easily consuming the remaining budget, even though we are already nearing the end of the school year.
Another example might need more careful analysis. A new utility contract that starts six months into the school year with an overall increase of 6% in pricing. The impact may be greater than the projection as the school year progresses. Evaluate your numbers carefully.
Look Beyond the Totals
Not all expenses behave the same way. Regular payroll costs may remain stable while overtime, utilities, or one-time expenditures fluctuate significantly. Reviewing major line items individually helps identify unusual events that could distort trends and lead to misleading projections.
For example, in the spreadsheet example, we removed a boiler repair in February, because the expenditure was significant and not likely to be repeated. To leave that in would have skewed the numbers and compromised the analysis.
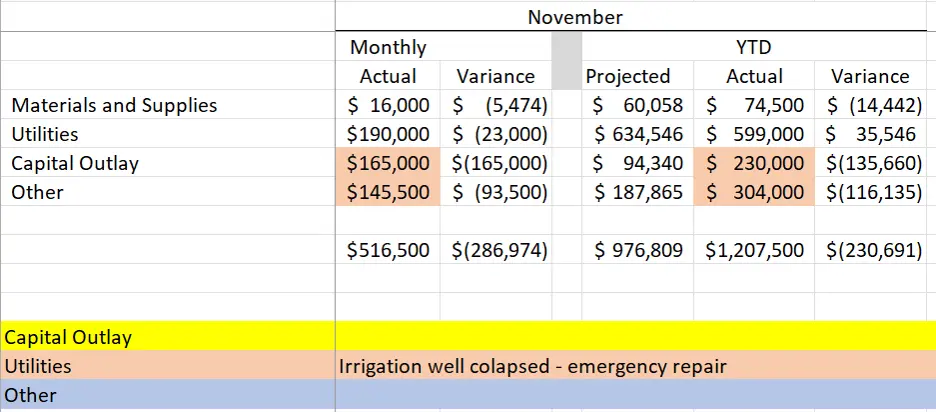
Our 2025/2026 budget shows normal variances, requiring no action. However, in November there was an emergency repair of an irrigation well system (highlighted). That number caused a lot of overtime, materials and outside construction, which should be evaluated, with recommendations made to the board.
Give the Board Meaningful Information
Detailed analysis allows financial leaders to identify which information is most meaningful to trustees. Effective board reports focus on significant variances, emerging trends, unusual expenditures, and projected outcomes rather than overwhelming readers with account-level detail.
Most importantly, financial results should be interpreted within both historical patterns and current operating conditions.
The goal is not merely to report where the district is today. Your goal is to use historical information to understand why it is there, where it is headed, and whether action is needed.
Monthly reports to the board should be meaningful. The reports need to highlight items that require monitoring, review, or action. Meaningful reports highlight the issues that require monitoring, discussion, or board action and provide decision-makers with the context needed to make informed choices.
As always, we welcome your thoughts, comments or questions.
Jim Schiele is Linebarger’s School Financial Consultant. He offers free assistance to Linebarger school district clients as they navigate budgets and meet financial deadlines. He can be reached at jim.schiele@lgbs.com.
This content is intended and provided solely for educational and/or informational purposes. It is not intended to provide legal advice, nor does your receipt of this content create an attorney-client relationship. This content is not a substitute for the specific legal advice of an attorney licensed in your jurisdiction.
If you are a current or prospective client this content may be subject to the attorney-client privilege or the attorney work product privilege or otherwise be confidential. Any dissemination, copying or use of this content by or to anyone other than the designated and intended recipient(s) is unauthorized.